
Introduce
서비스를 운영하면서 중요한 메트릭을 수집해서 모니터링 할 수 있는 환경을 구축해보았습니다.
Prometheus 설치
$ helm repo add prometheus-community https://prometheus-community.github.io/helm-charts
$ helm install prometheus prometheus-community/prometheus
Grafana 설치
nginx ingress를 사용하기 위해서 values.yaml을 수정했습니다.
nginx ingress는 설치되어 있어야 합니다. 저는 ci/cd할때 설치가 되어 있어서 바로 진행하겠습니다.
$ helm repo add grafana https://grafana.github.io/helm-charts
$ helm show values grafana/grafana > values.yaml
//values.yaml에서 root_url과 serve_from_sub_path 추가
server:
domain: "{{ if (and .Values.ingress.enabled .Values.ingress.hosts) }}{{ tpl (.Values.ingress.hosts | first) . }}{{ else }}''{{ end }}"
root_url: http://localhost/grafana
serve_from_sub_path: true
아래 yaml 파일을 이용해서 grafana용 ingress를 띄워줍니다.
//ingress yaml 파일
apiVersion: networking.k8s.io/v1
kind: Ingress
metadata:
  name: grafana-ingress
  namespace: prometheus
spec:
  rules:
    - host: localhost
      http:
        paths:
          - path: /grafana
            pathType: Prefix
            backend:
              service:
                name: grafana
                port:
                  number: 3000


//ingress 띄우는 명령어
$ kubectl get apply -f grafana-ingress.yaml
이렇게 localhost/grafana로 접근되는 것을 확인할 수 있습니다.
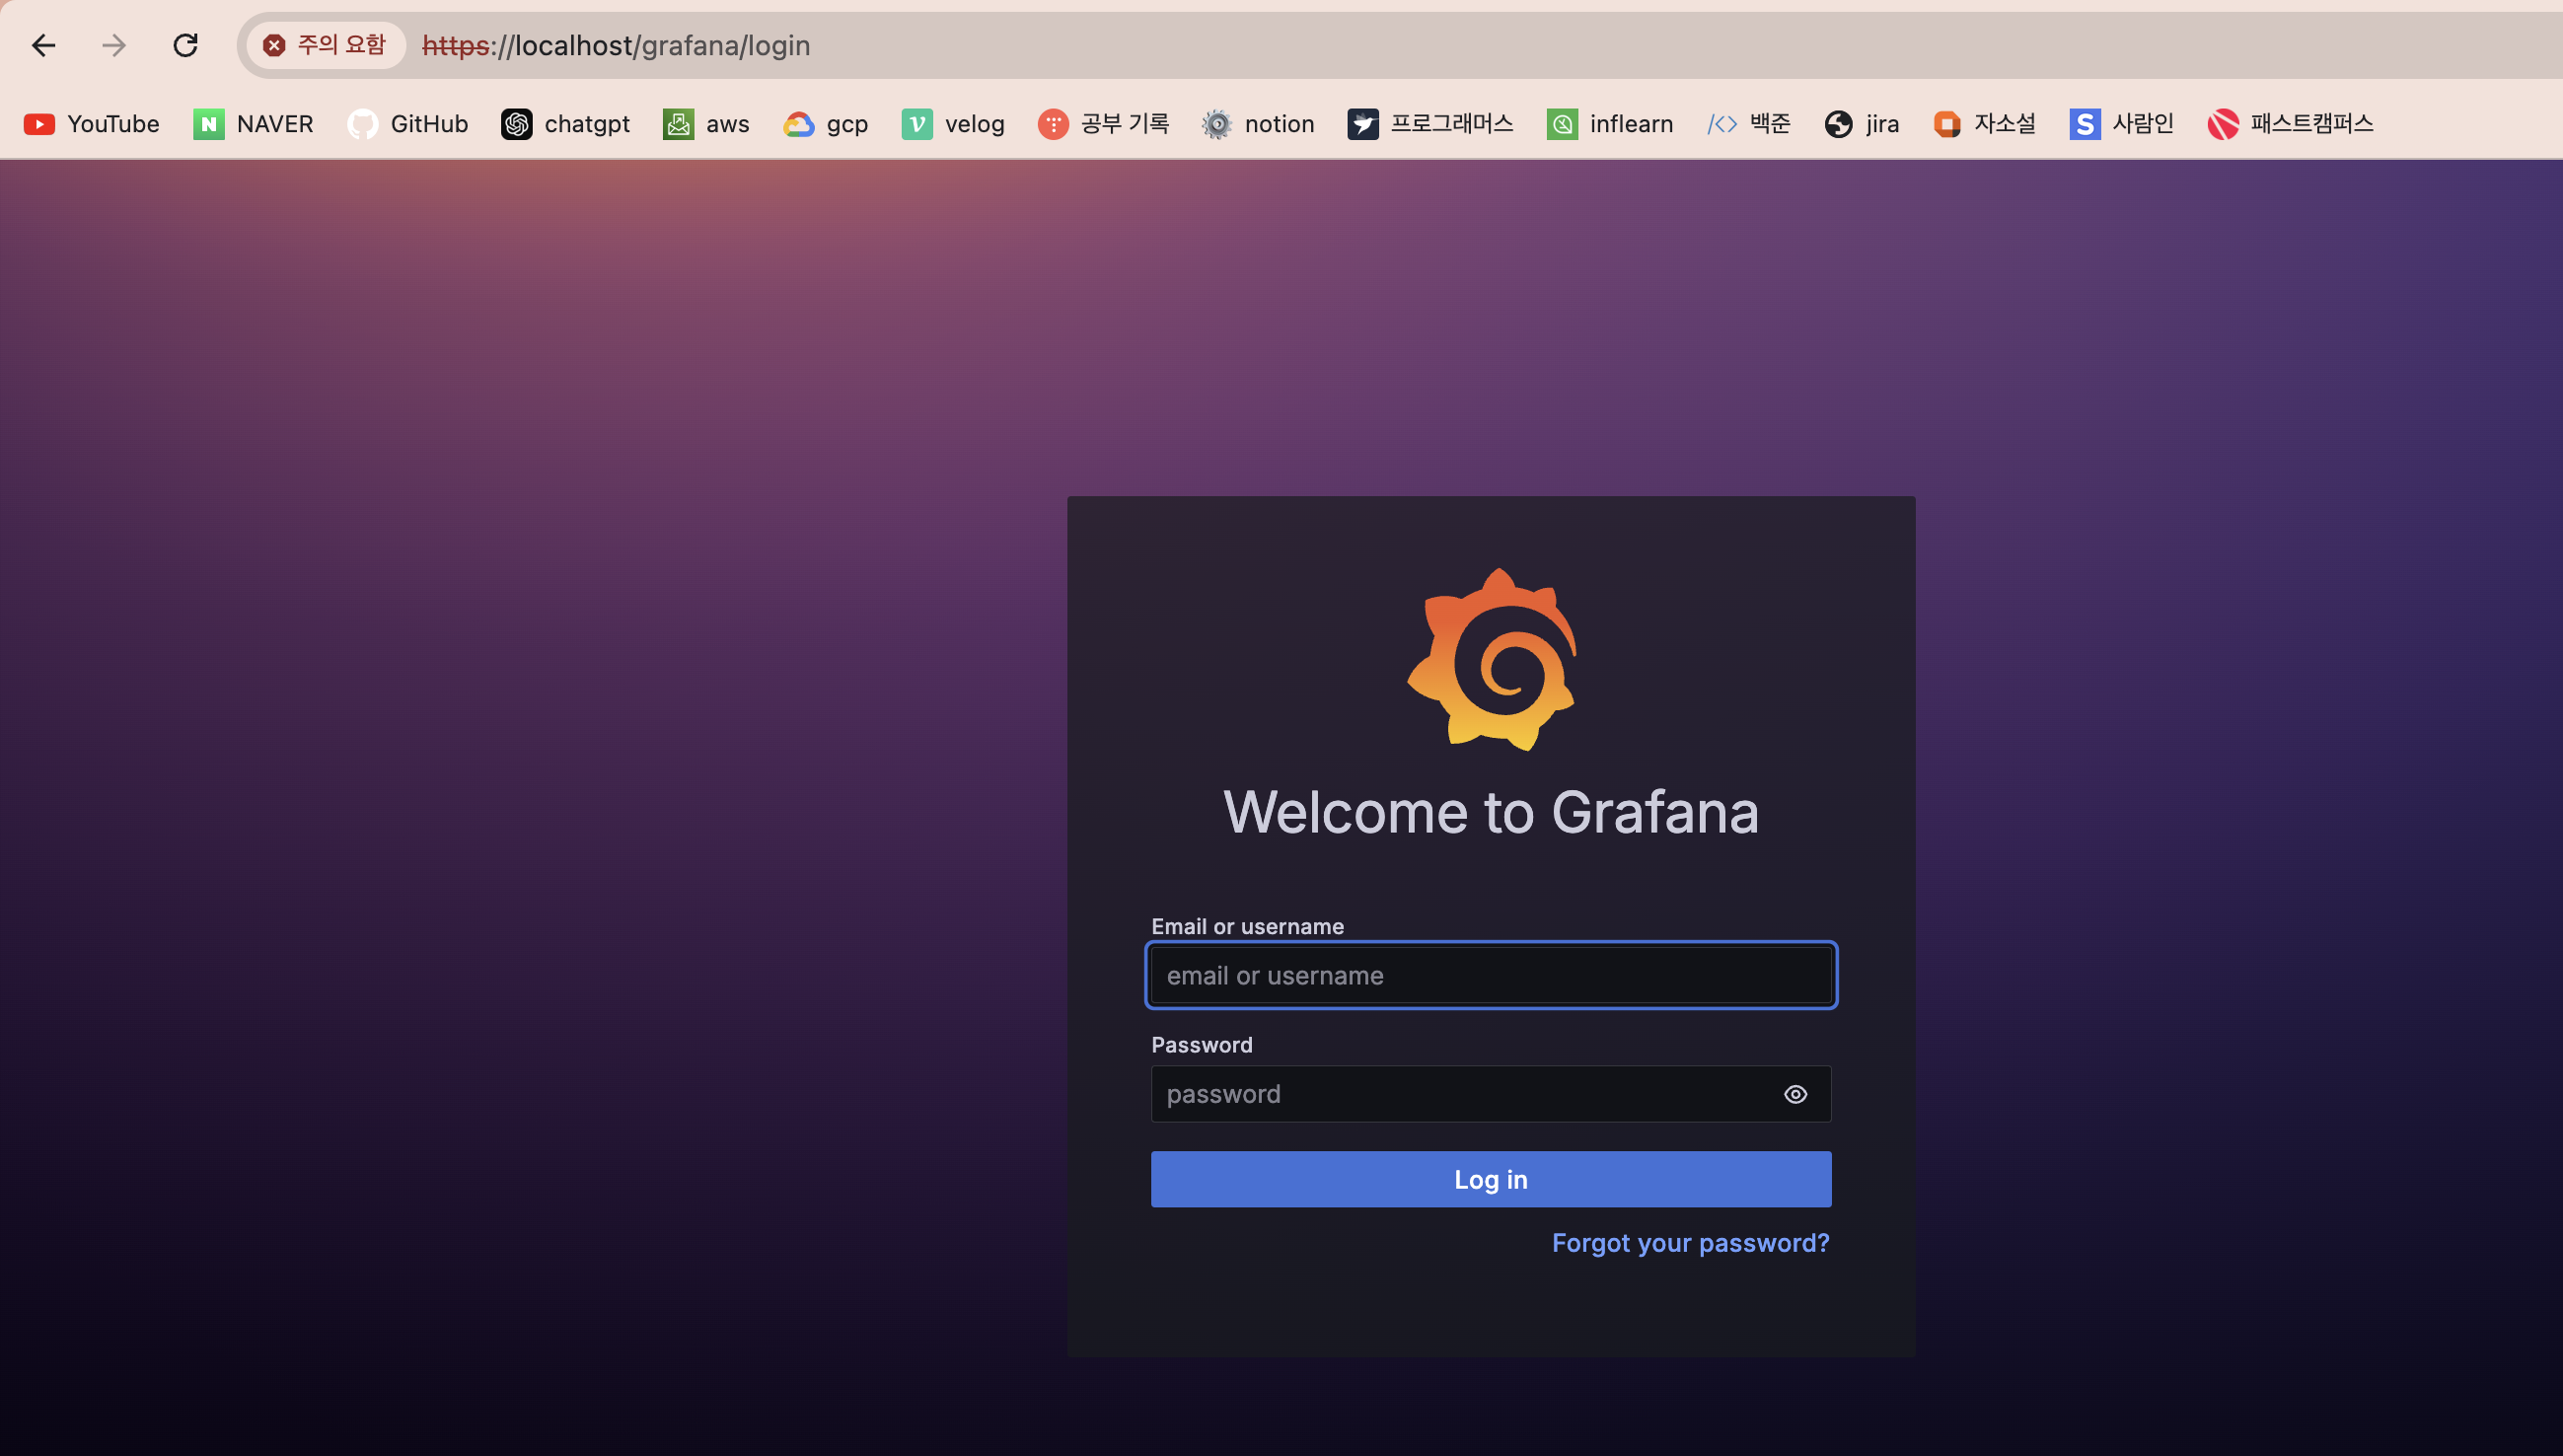
grfana 로그인
아이디 : admin
password : 아래 명령어 결과
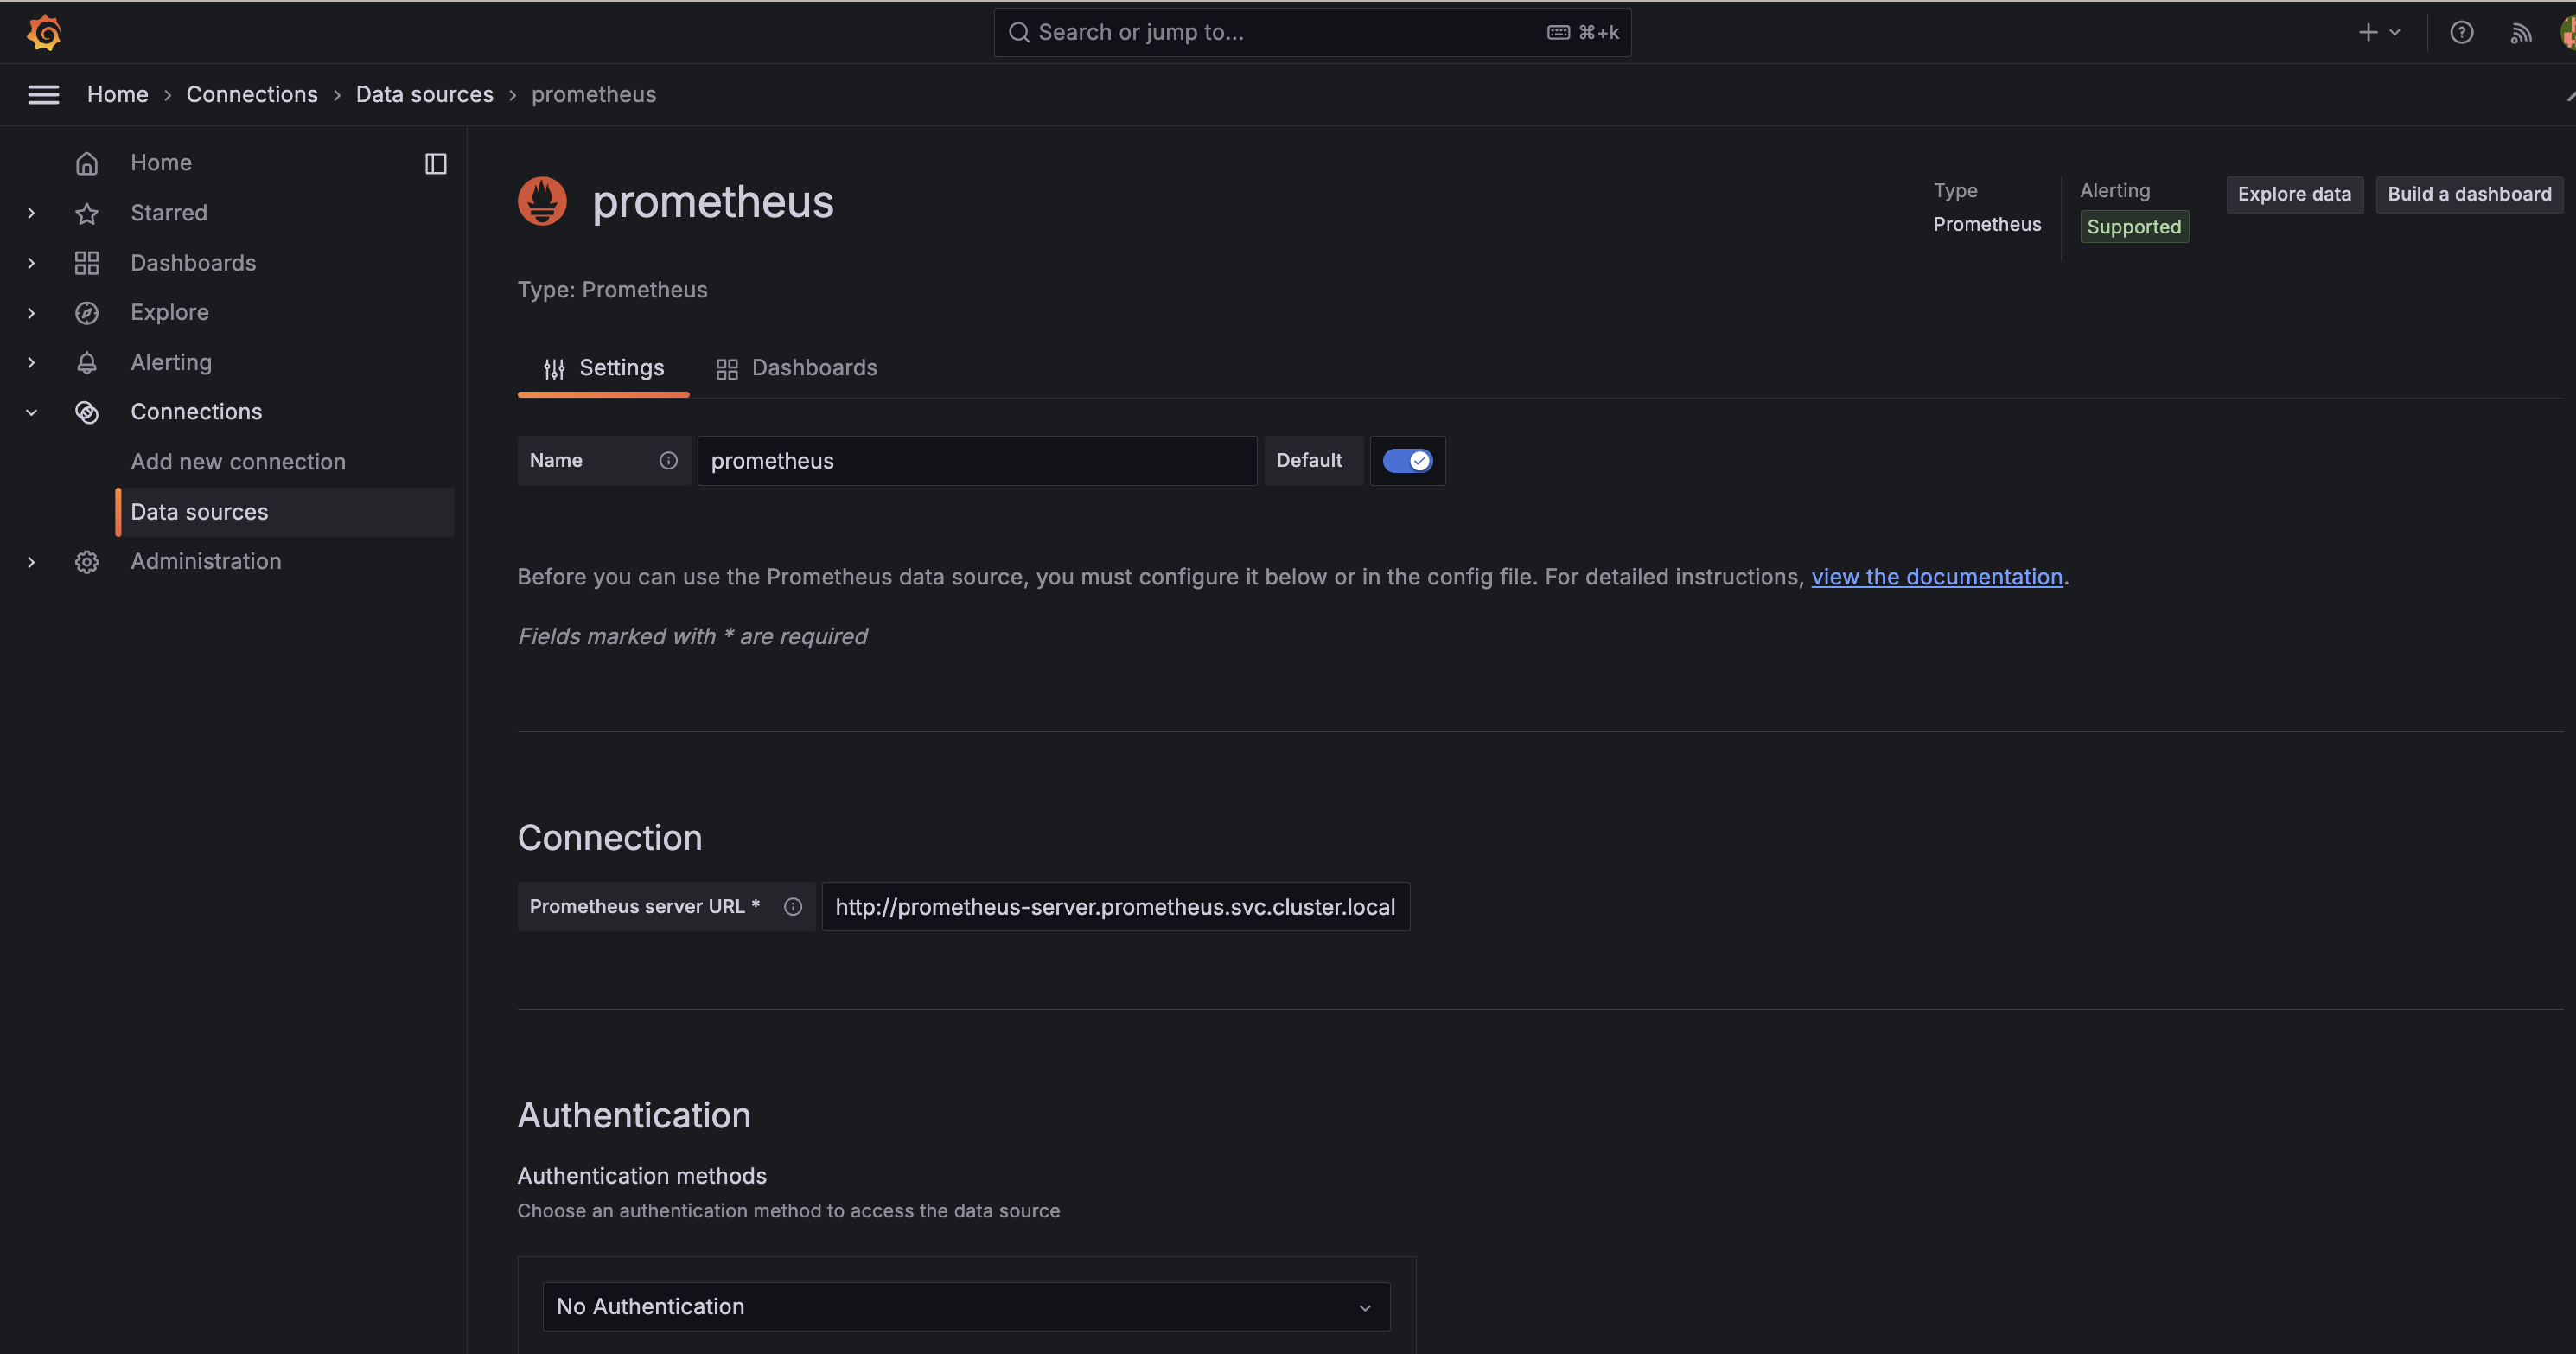
kubectl get secret grafana -o jsonpath="{.data.admin-password}" | base64 --decode ; echoprometheus 연결하기
connection -> datasource에서 promethus로 들어옵니다.
prometheus url에 http://prometheus-server.prometheus.svc.cluster.local 를 적어줍니다.
같은 클러스터에 있어서 service DNS를 입력해주면 됩니다.
url에서 prometheus는 본인 namespace로 적어야합니다.
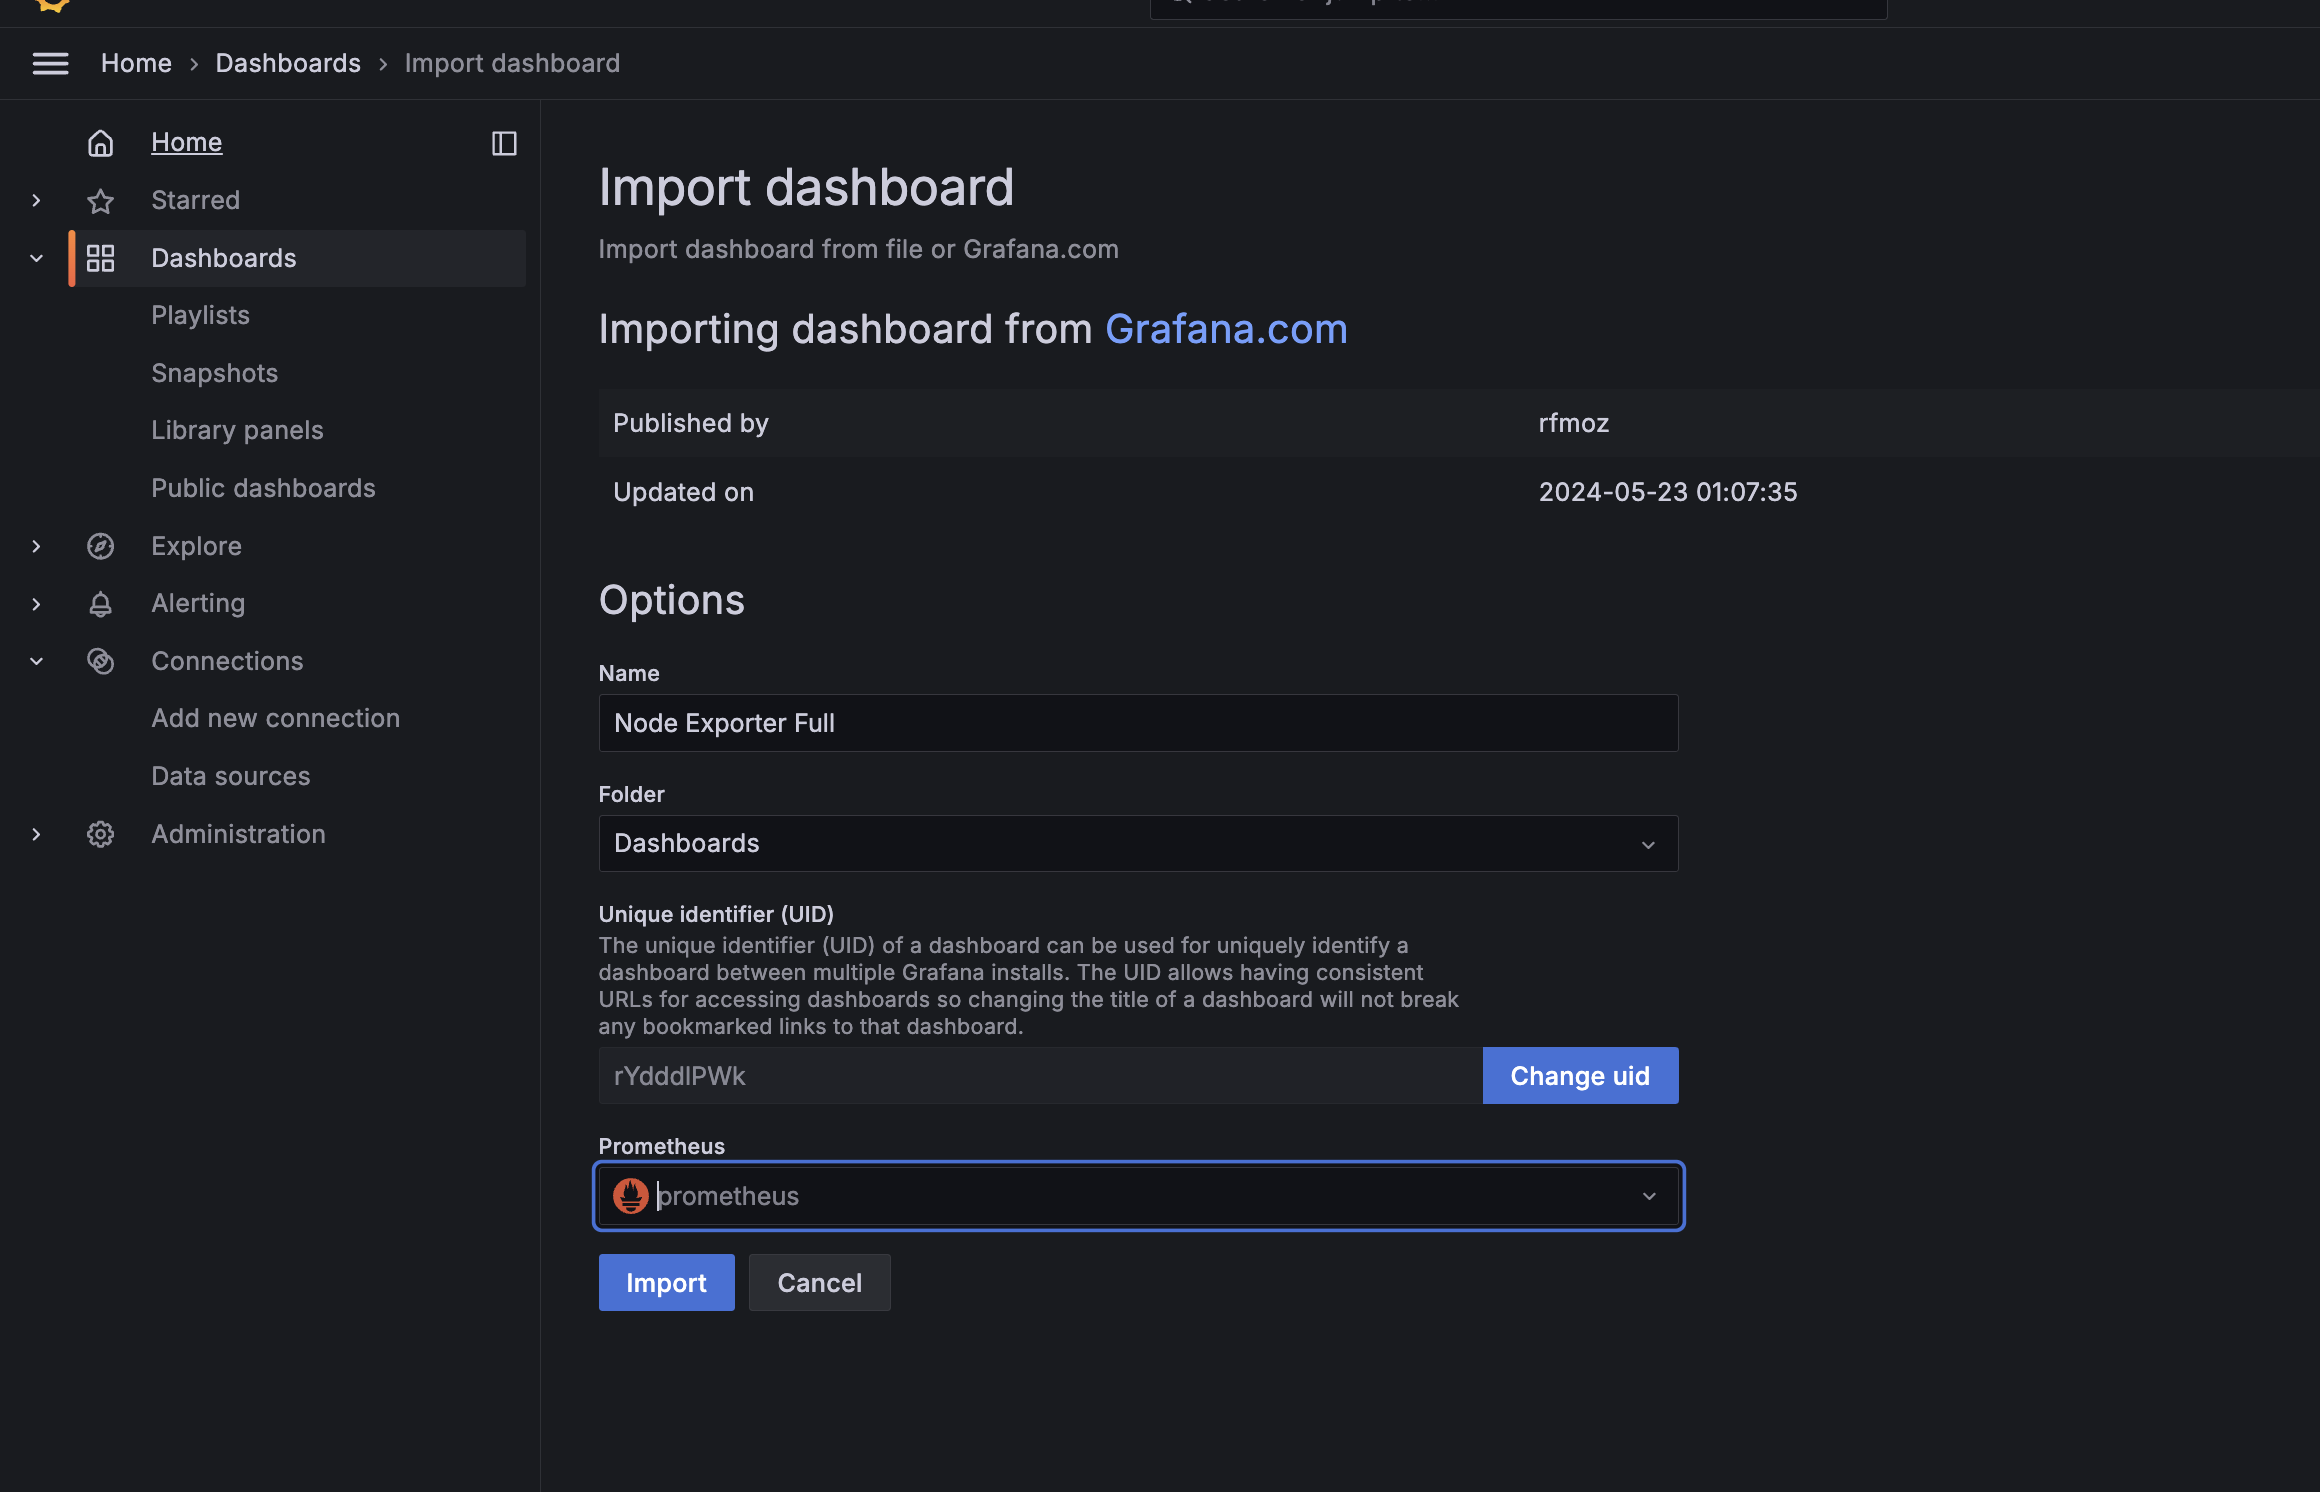
대쉬보드 구성하기
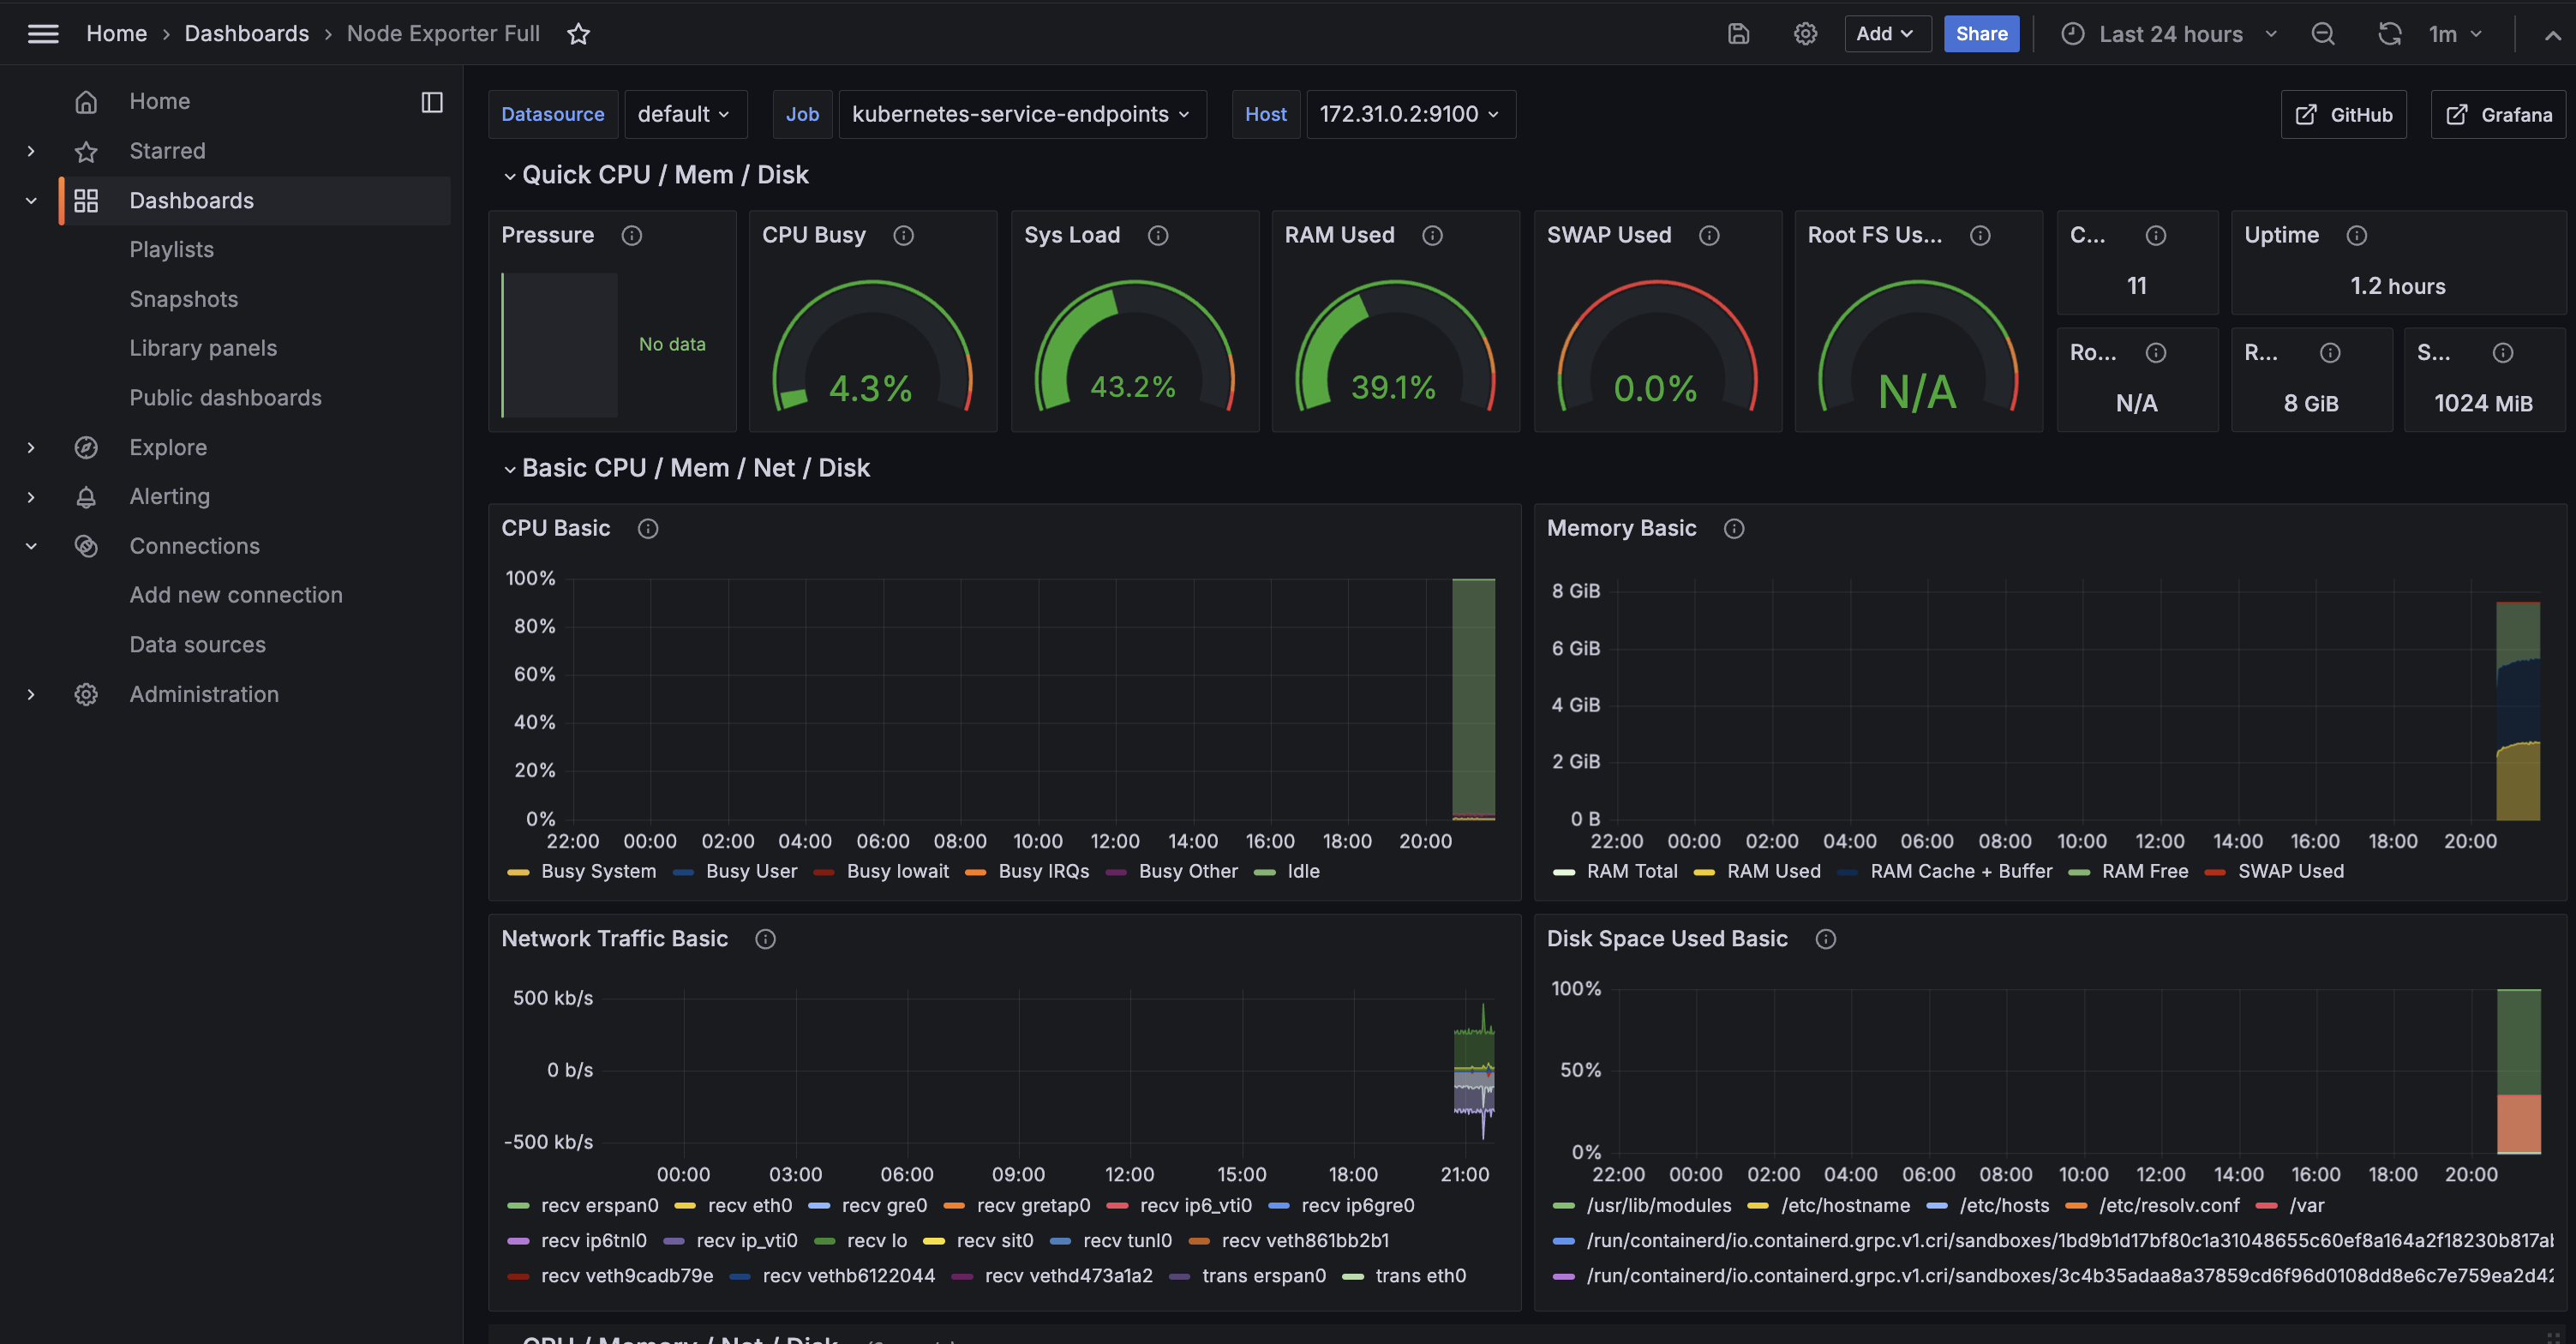
dashboard import에서 Node Exporter를 import 하기 위해 1860을 load하고 아까 연결한 promethus를 선택합니다.
이제 대쉬보드를 통해 모니터링 할 수 있습니다.
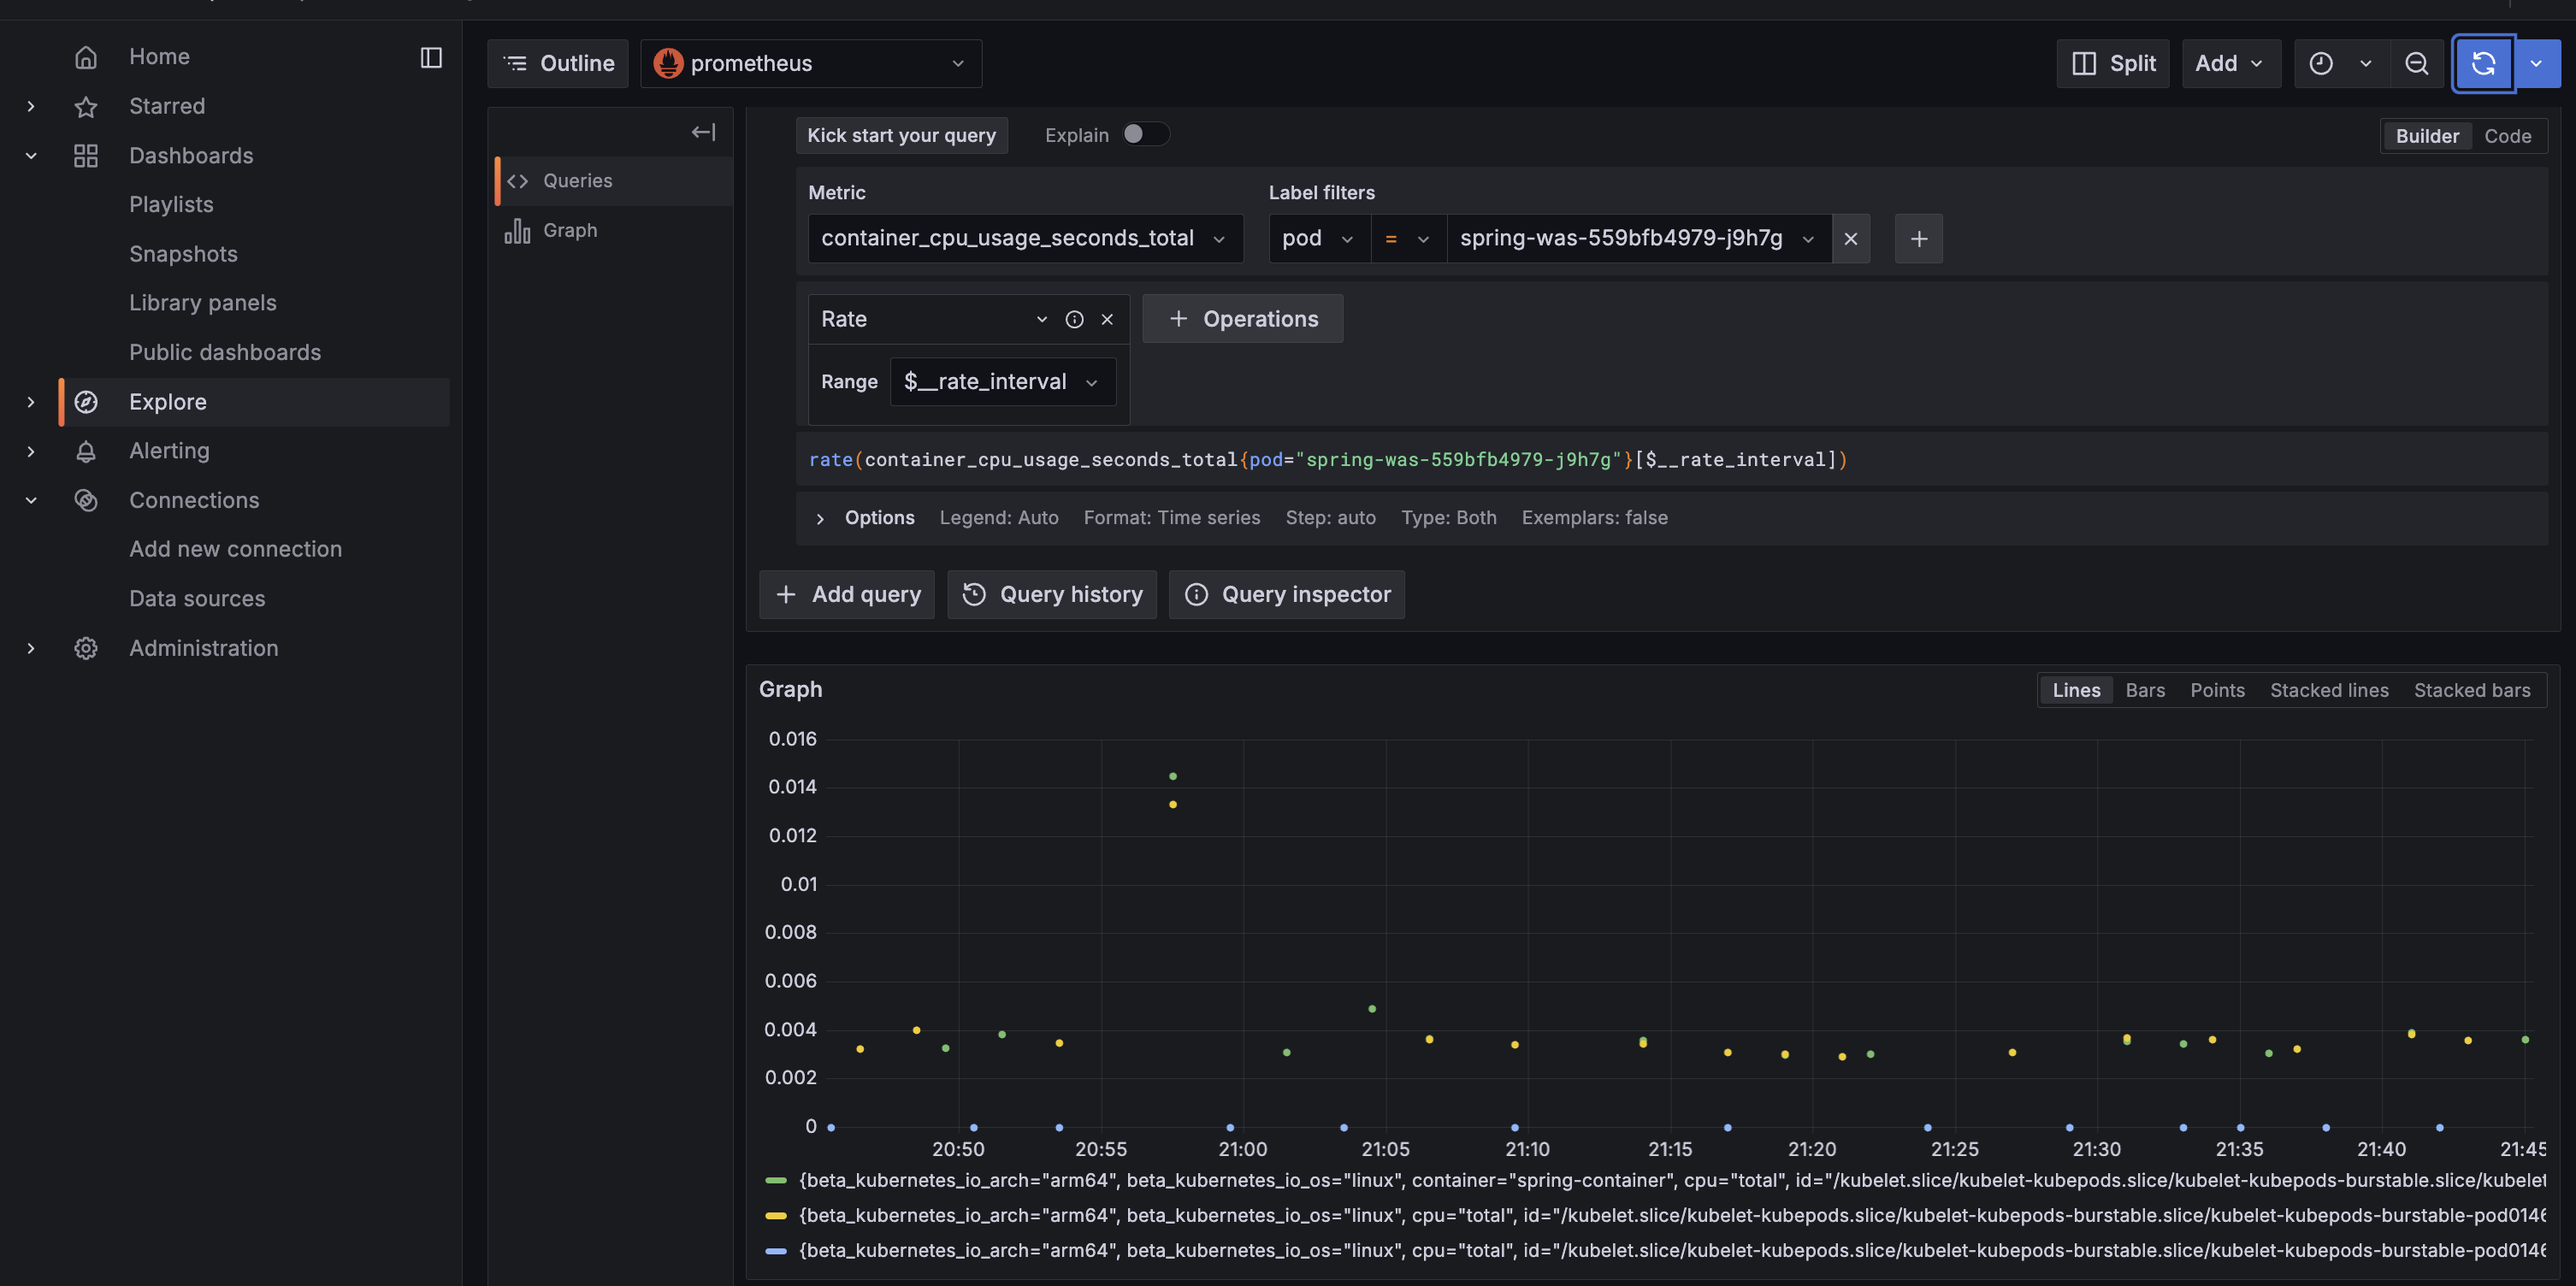
직접 커스텀해서 대쉬보드에 띄우기
추가적으로 PromQL을 이용해서 내가 원하는 방식으로 커스텀해서 대쉬보드에 띄울 수 있습니다.
Metric에서 어떤걸 수집할건지 선택하고 Label filter를 통해서 어디서 수집할건지 operation에서 어떤 방식으로 보여줄건지 선택합니다.
스프링 메트릭 수집
스프링에서 actuator 라이브러리를 이용해서 엔드포인트를 노출시키면 프로메테우스를 이용해 쉽게 메트릭을 수집할 수 있습니다.
마무리
kind 클러스터 내부에 prometheus를 이용해 메트릭을 수집하고 grafana를 이용해 시각화를 해봤습니다. 다음에는 실제 동작중인 스프링 api 서버를 prometheus를 이용해서 메트릭을 수집해보겠습니다
'Ops' 카테고리의 다른 글
| CircleCI를 이용한 배포 자동화 (1) | 2025.02.06 |
|---|---|
| Jenkins로 ci/cd 파이프라인 구축하기(3) (0) | 2024.12.04 |
| Jenkins로 ci/cd 파이프라인 구축하기(2) (0) | 2024.12.04 |
| Jenkins로 ci/cd 파이프라인 구축하기(1) (0) | 2024.12.04 |
| k8s 환경에 내 서비스 띄워보기 (0) | 2024.12.04 |